Free 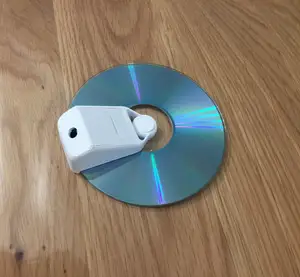
Spectroscope
MakerWorld
Introduction
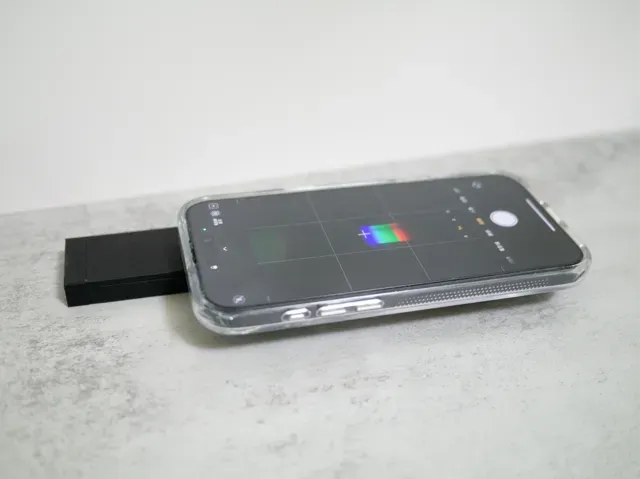
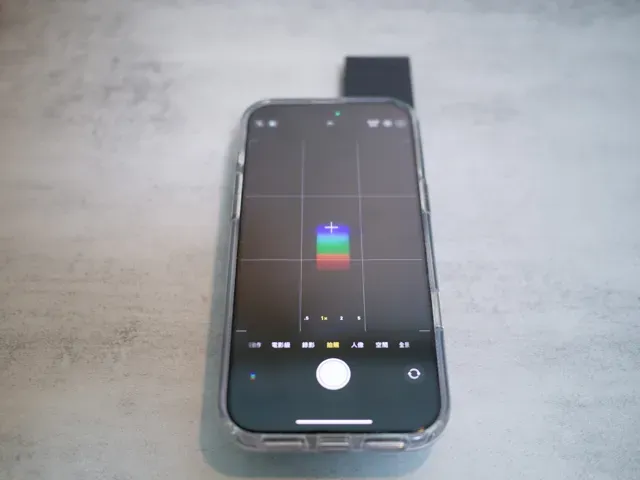
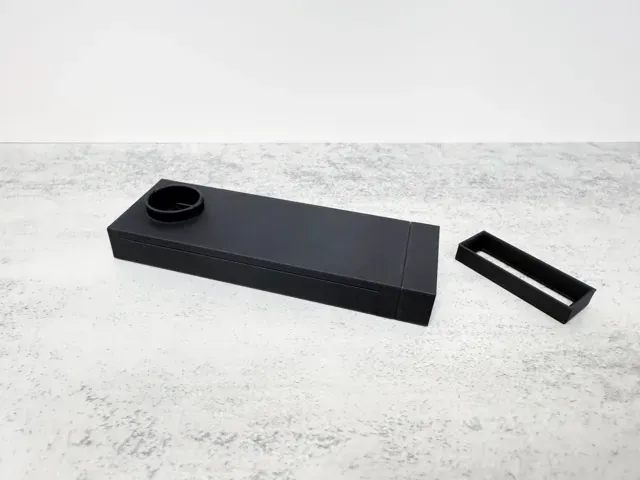
Here’s a simple but fully functional DIY smartphone spectrometer , built using nothing more than a CD and a 3D printed enclosure.
It’s designed for science education and maker projects. By using the spiral grooves of a CD as a reflective diffraction grating, it splits ordinary white light into a colorful visible spectrum—making wavelength separation easy to observe.
The entire body is 3D printed and compatible with most modern smartphones (≤Ø16mm lens). With just a few basic parts and minimal tools, it’s quick to assemble and perfect for classroom demonstrations, science fairs, or home experiments .
What You’ll Need
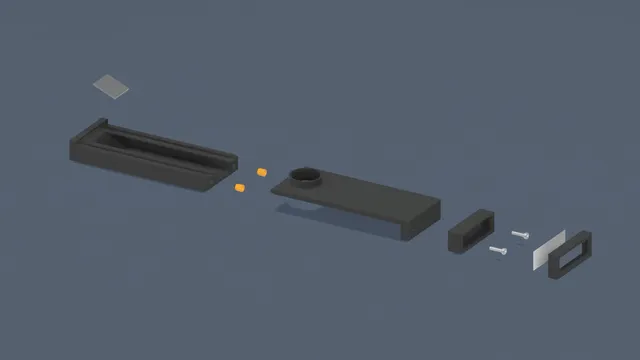
- CD (reflective grating) – Use a blank, unused CD for best diffraction clarity - Slit module (0.1–0.2 mm width) – 3D printed; requires precise XY calibration . Ideally, the slit should fit a single sheet of A4 paper (≈0.104 mm thick)
Strongly recommended: calibrate your printer before slicing
Calibration model
https://makerworld.com/models/1307486
Bambu Lab guide
https://wiki.bambulab.com/zh/software/bambu-studio/xy-hole-contour-compensation
- 3D printed body – Matte black PLA is recommended to minimize reflection and diffuse scattering while maintaining good rigidity. - Tracing paper (optional) – Helps diffuse bright light sources - Fine sandpaper (optional) – Reduces internal reflection for better contrast
Key Highlights
- Perfect for science classes, maker demonstrations, or at-home STEM exploration - Modular components for easy replacement or upgrades - Compatible with most smartphones, including iPhone and Android devices Suggested Light Sources for Classroom Experiments
This device can be used by educators to demonstrate the spectral characteristics of various light sources:
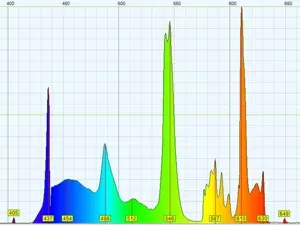
- LED bulbs – Discrete band spectrum with sharp transitions - Fluorescent lamps – Spiky, jagged emission spectrum - Sunlight – Continuous blackbody spectrum - Laser pointer – Single-wavelength monochromatic light
Assembly Steps
Design Principle: Diffraction Grating Equation
This spectrometer is based on reflective diffraction , using the spiral grooves on a CD to produce interference and separate wavelengths of visible light.
Symbol Description
m Diffraction order (set to m = 1)
λ Wavelength (in nm)
d Grating spacing (CD ≈ 1.6 μm)
α Angle of incidence (59° in this design)
β Angle of diffraction, varies by wavelength
Assuming a 13 mm internal light path, the diffraction angles calculated above would project a visible spectrum band approximately 2.87 mm wide on a typical smartphone camera sensor (which is around 8–9 mm in width). This setup clearly displays the transition from violet to red wavelengths, ideal for real-time spectral observation.
Sample Spectral Images
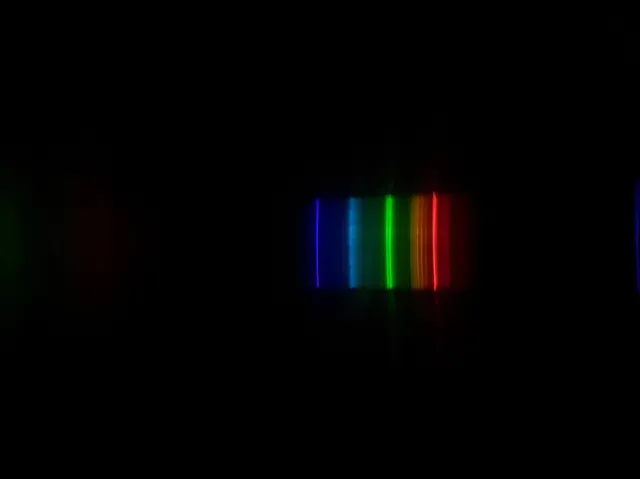
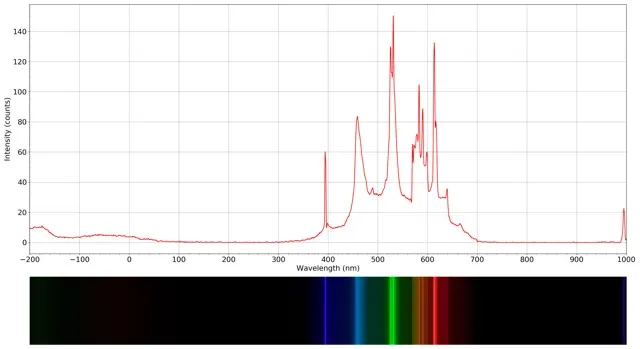
Here are real images captured using this spectrometer and a smartphone. You can clearly observe the spread of visible wavelengths from violet to red, with distinct spectral features for each light source.
Calibration & Analysis Results
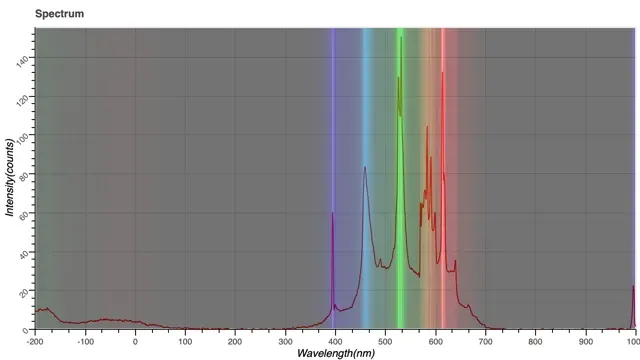
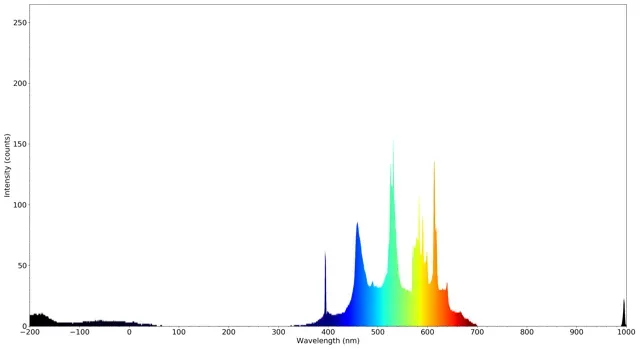
Using known light sources (e.g., laser pointers, green LEDs), you can calibrate pixel positions against their respective wavelengths.
With image processing tools like ImageJ , you can convert the spectrum image into grayscale intensity plots and analyze RGB channel responses—perfect for building your own material spectrum reference library.
How to Calibrate a Spectrum Image Using ImageJ and Excel
When you capture a spectral image, whether from a DIY spectrometer or a lab-grade setup. You're usually left with a photo where the x-axis is measured in pixels, not wavelengths.
To extract meaningful data from this image, you need to calibrate it: map pixel positions to real physical wavelengths.
This guide walks you through how to do just that using ImageJ and Excel . It's perfect for students, hobbyists, and makers working on light optical projects.
Why Calibrate a Spectrum Image?
The x-axis of a raw spectral image only shows pixel positions. To interpret the data physically, like identifying specific emission lines or absorption bands, you must convert those pixel values into actual wavelengths. This is called wavelength calibration.
You’ll use a light source with known emission lines (such as a fluorescent bulb, mercury lamp, or gas discharge tube) to match pixel positions to real-world wavelengths.
What You’ll Need
- ImageJ : A free, open-source image analysis tool.
0.2mm layer, 2 walls, 15% infill
Names are used only to indicate the source of a result. Polyzon is not affiliated with the listed sites.