
Free 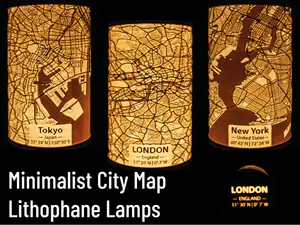
Minimalist City Map Lithophane Lamps
MakerWorld


Disclaimer
This is a writeup of my workflow on how to create minimalist city map lamps like the ones below. T he workflow can also be used to turn any image into a cylindrical lithophane lamp. Skip to “Creating Lithophanes” if you already have an image.
Due to the overwhelming demand to create specific cities for people (which I cannot fulfill), I decided to publish everything required to create your own city map lamp. I will however not provide any support to this workflow. If you cannot make it work, you're on your own!
All of my settings (especially the map rendering settings) are mere recommendations and reflect my personal preferences. Feel free to experiment with the design as you deem fitting. Only keep in mind that if you change the image aspect ratios, you'll also have to adapt lithophane settings and the thread design (F3D files are available!).
What I am sharing here is only a workflow. More specifically, the one I found to work well for my needs. I am completely new to map rendering and learned how to do it just for this project. A lot of what I am showing here can perhaps be done better, faster and more efficient. And I am by now means an expert on any of the following topics. If you find improvements, feel free to share them as a comment!
All screenshots show the mentioned software at their most up to date version (as of 03.2025). There may be updates in the future, making my screenshots wrong or obsolete.
Licensing
Everything published here is public domain . You're free to use your own works in any way you like. No need to credit me, no need to publish it as a remix . You're free to choose your own license and sell your own designs. You may also include the bases (provided here) with your upload.
I still suggest that if you're uploading your design, that you do so as a remix of my collection : https://www.printables.com/model/1203176-minimalist-city-map-lithophane-lamps. This will make it easier for people to find your model and both, my upload and your upload can profit from each other's popularity. If you upload it as a remix, please do not upload it as a remix of this tutorial but as a remix of the collection . But again, this is only a suggestion and you're free to do whatever you prefer!
Prerequisites
There is quite a bit of software required to create a map lamp. Thankfully, all of the software required is free! The following list assumes you are running a windows computer. In addition to the software linked below, you'll need a minimum of 8GB of RAM. The software requirements are:
- Python - if you're not familiar with python, I recommend simply installing Anaconda under the following link: https://www.anaconda.com/download . No need to sign up on this page. There's a Skip registration button. - GDAL - The following instruction assumes that you installed Anaconda! For other installation instructions, see https://gdal.org/en/stable/ . Launch Anaconda Prompt. If you're on a windows machine, simply type in Anaconda Prompt in the start menu. In the prompt popping up, type in: conda install -c conda-forge gdal - QGIS - excellent map rendering software, available here: https://qgis.org/download/ - Blender - download and install Blender: https://www.blender.org/download/ - PrusaSlicer - If you're not already using PrusaSlicer, download and install it: https://www.prusa3d.com/page/prusaslicer_424/ . Other slicers may work too. We only require an stl repair algorithm. - Inkscape or GIMP - if you want to do some image editing or add texts/labels to your maps. Inkscape: https://inkscape.org/release/ GIMP: https://www.gimp.org/downloads/
Creating Maps
The first step to create your own map is, to obtain OpenStreetMap data of the region you want to create a lamp for. You may obtain them from websites such as Geofabrik ( https://download.geofabrik.de/ ) or Openstreetmap.fr ( https://download.openstreetmap.fr/extracts/ ). On both websites, you can download extracts rather than a complete dataset for a continent or country. It's usually best to download the smallest dataset available that contains your city.
In some cases, you may also need to download sea map data. You can find it here: https://osmdata.openstreetmap.de/data/water-polygons.html . Pick the second download option: Shapefile format, Mercator projection and Large polygons are split . Only download this file if necessary. More details below.
Assuming you found the correct dataset, you should be left with a file ending on .osm.pbf . This is a compressed file format ! I highly recommend to convert to a uncompressed format to avoid very long rendering times. To do so, you'll need GDAL. To use GDAL, again launch Anaconda Prompt and type in the following command:
ogr2ogr -f sqlite -dsco spatialite=yes "<path><filename>.sqlite" "<path><filename>.osm.pbf" <path> is to be replaced by the path where your file is located and <filename> by the filename. For example:
ogr2ogr -f sqlite -dsco spatialite=yes "C:\Users\FritzPeppone\Downloads\barcelona.sqlite" "C:\Users\FritzPeppone\Downloads\barcelona.osm.pbf" The above example converts an .osm.pbf file to a .sqlite file. Both are located in my Downloads folder.
If you successfully created your .sqlite file, it's time to start QGIS. Create a new project (1). Then click on Layer (2) → Add Layer (3) → Add Vector Layer… (4).
In the menu popping up, click on … (1) and pick your .sqlite file. Make sure to not accidentally pick the .osm.pbf file. Finally, click on Add (2).
Another menu pops up where you can choose which layers to add. Choose lines and multipolygons (1), (2). Finish by clicking on Add Layers (3) and close the first menu by clicking Close (4).
Now, you should already see a basic rendering of the map you just downloaded. It should look similar to this:
Your rendering now contains two different types of renderings: lines and polygons. Both without any formatting. We need the lines to render streets, paths or railway lines and the multipolygons to render buildings, water bodies or rivers. Now, we have to pick aedequate rendering settings.
First, I recommend to switch to a Mercator map projection. Since we're usually confronted with maps from google maps or similar, we're used to their Mercator projection. To do so, click on EPSG:4326 in the bottom right corner (1). Next, in the Filter console, type in EPSG:3857 (2). Now, in the filtered list of projections, pick WGS 84 / Pseudo-Mercator (3). You may have to navigate there by clicking on Projected → Mercator first. Finally, click on Apply (4).
Now we start by rendering streets correctly. I suggest you to first disable the multipolygons by removing the respective tick (1). There are multiple different types of streets, ordered by their size:
- motorway - trunk - primary - secondary - tertiary - residential - footpath For my minimalist map representations, I chose to render them in different line widths in descending order. This can be achieved by selecting the lines layer (2), right click and select Properties… (3) or simply double click it.
To filter for different street types, first select Source (1), the Query Builder (2).
In the next window, type in a filter expression (1) to pick a specific line type. Here are some examples to show the syntax:
If you want to get lines for both, motorway AND trunk:
"highway" = 'motorway' OR "highway" = 'trunk' If you want to filter for primary streets:
"highway" = 'primary' If you want to obtain all lines from a specific group, e.g. every railway related lines, type:
"railway" IS NOT NULL more sophisticated search queris are possible. The following for example searches other_tags for strings containing the word coastline and thus extracts said coastline:
"other_tags" LIKE '%coastline%' I think, you get the idea how this works. If you want to render something specific, google or LLM AI such as Gemini or ChatGPT are good sources to find out which query will output the exact thing you need. For my maps, I used at most 6 or seven different queries. These queries are a really powerful tool and I am using at most a percent of what can be done. If you want to learn more, you'll have to do your own research though (as I am no expert on QGIS).
After defining our Filter, we can test if it works by clicking Test (2). The filter works if it contains more than one element. Finally, click OK (3) if your filter works.
Now, we have filtered the lines layer. In our example, I have filtered out motorways and trunk streets. Next, we pick rendering settings. To do so, click on Symbology (1). In my example, I am using a Simple Line (2). You may also choose more complex line or path designs (3). First, I set the width units to Meters at Scale (4).
Next, we pick a different color (1), confirm by clicking OK (2) and set the line width (3). My default settings are displayed in the table below. Keep in mind that for a regular lithophane, only greyscale colors are relevant. Finally, confirm by clicking OK (4).
Your result should look something like the following image. Now, you still need to render further lines. To do so, right click on your lines layer (1) and click Duplicate Layer (2). For proper organisation, also consider renaming your layers appropriately.
By default, my renders contain the following layers with these filters and settings:
- motorway and trunk < “highway” = ‘motorway’ OR “highway” = ‘trunk’ > , Width: 80 Meters at Scale, color: black, Opacity: 100% - primary < “highway” = ‘primary’ > , Width: 60 Meters at Scale, color: black, Opacity: 100% - secondary < “highway” = ‘secondary’ > , Width: 40 Meters at Scale, color: black, Opacity: 100% - tertiary and residential < “highway” = ‘tertiary’ OR “highway” = ‘residential’ > , Width: 20 Meters at Scale, color: black, Opacity: 50% These are only recommendations though. Be creative and design your own maps as you find fitting. You can also check out the example project files (ending on .qgz ) I uploaded.
Next, we want to render water bodies This works similarly to the line rendering. First, we filter the multipolygon layer . The easiest filter should output almost all water bodies such as rivers, ponds and sea:



Names are used only to indicate the source of a result. Polyzon is not affiliated with the listed sites.